
Educational content only. Not investment advice. This lesson explains how to read a chart. It doesn't tell you to buy or sell anything.
By the end of this lesson you can: say when a gold daily candle opens and closes in UK time, convert any chart time between UK time, broker server time and New York time, and spot the weeks in the year when the conversion changes.
Why the clock matters
Many levels in this course depend on time. A previous day high is the highest price of one day, so you need to know where that day starts and ends. A session range is the range between two clock times. An alert on a news release is useless if it fires an hour late. Getting the clock wrong shifts every one of these levels, and the mistake is easy to miss because the chart still looks normal.
The gold day runs from New York close to New York close
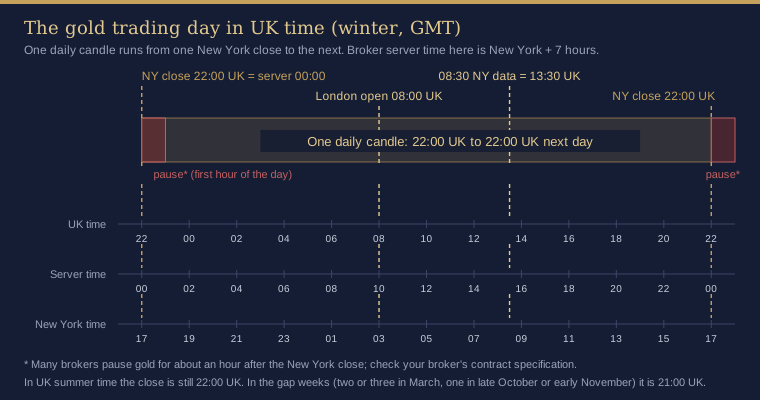
Spot gold trades almost around the clock from Sunday evening to Friday evening. The market convention for where one trading day ends and the next begins is the New York close at 17:00 New York time. On a chart that follows this convention, a daily candle covers 24 hours from one New York close to the next, not midnight to midnight in London.
In UK time:
- For most of the year the New York close is 22:00 UK. This holds in winter (both countries on standard time) and in summer (both on daylight saving time).
- For two or three weeks in March (the US has moved its clocks forward, the UK has not yet) and one week in late October or early November (the UK has moved its clocks back, the US has not yet), the close is 21:00 UK. In 2027 the gap weeks are 15 to 26 March and 1 to 5 November (trading days); the dates move every year, so check them each spring and autumn.
So a "Tuesday" daily candle, viewed from the UK, normally opens at 22:00 on Monday evening and closes at 22:00 on Tuesday. Price action between 22:00 and midnight UK belongs to the next day's candle.
Broker server time
MetaTrader 5 shows every bar in the broker's server time, not your local time. A common setting among gold brokers is a server clock at New York time plus 7 hours. With that offset, the New York close falls exactly at 00:00 server time, so each daily bar on the platform starts and ends at the New York close and the week has five daily candles, with no small Sunday candle.
Check this for your own broker rather than assuming it. The Market Watch window shows the server time of the latest price. Do this while the market is open, because at weekends it may stay at Friday's close. The test is this: server midnight should line up with 17:00 New York. If it does, check again in the next gap week; if it still does, the offset is New York + 7. Some servers change their clocks on European dates instead; they match New York + 7 for most of the year but not in the gap weeks. If yours doesn't line up, your daily candles end somewhere else, and previous day levels on your chart can differ from those on a chart whose days close at the New York close.
Many brokers also pause gold for around an hour after the New York close, which is the first hour of the next daily candle. Prices around that pause can be thin or missing, and spreads usually widen there, so a high or low printed by a spread spike may not reflect where most of the market was dealing. Treat that window with care when you read highs and lows.
Converting between the three clocks
With a New York + 7 server:
| UK winter (GMT) | UK summer (BST) | Gap weeks | |
|---|---|---|---|
| Server time = | UK time + 2 h | UK time + 2 h | UK time + 3 h |
| New York close | 22:00 UK = 00:00 server | 22:00 UK = 00:00 server | 21:00 UK = 00:00 server |
| London open 08:00 UK | 10:00 server | 10:00 server | 11:00 server |
The offset between UK and server time is two hours for most of the year because both the UK and the US move their clocks by an hour. It changes during the gap weeks, when only one country has moved: then server time is UK time + 3 h and the New York close is 21:00 UK.
A quick way to avoid mistakes: work in New York time for anything to do with the trading day and US data releases, and convert only when you need another clock: UK time for a phone alarm or your journal, server time for times you enter or read on MT5 charts. A US release at 08:30 New York is 13:30 UK for most of the year and 12:30 UK in the gap weeks.
Charts on other platforms
On web charts, where the daily candle starts depends on the data feed: some XAUUSD feeds close the day at 17:00 New York, others at midnight UTC or another time. Changing the chart's time zone usually changes the axis labels, not where the daily candle starts. If your web chart's daily candles close at midnight UTC (or any time other than the New York close), its previous day high and low may not match an MT5 chart whose days close at the New York close. Neither is wrong; they measure different days. Pick one convention, write it at the top of your level plan, and use it every day. This course uses the New York close.
How the indicator shows this
Line Alert Snap takes its swing points from the bars of its Swing timeframe (the chart timeframe by default), timed in the broker's server time. On the daily (D1) chart the bars start at server midnight, and on the 4-hour (H4) chart at 00:00, 04:00, 08:00 and so on server time, so a different server offset can give different swing points and different levels. On lower timeframes the day boundary matters mainly when you read levels against a calendar: a swing at 23:30 UK belongs to the next trading day. When you compare an alert with the chart, read the bar time on the chart's axis, which is server time, and convert it with the table above before writing it in your journal in UK time.
Common mistakes
- Taking the previous day high from a chart whose days end at UK midnight, then comparing it with levels built on the New York close.
- Assuming the UK to server offset is fixed all year and missing the gap weeks in March and in late October or early November.
- Typing a release time quoted in UK or New York time into an MT5 alert without converting it to server time.
- Reading the thin prices just after the daily pause as meaningful highs or lows.
Key takeaways
- A gold trading day runs from 17:00 New York to 17:00 New York: normally 22:00 UK, but 21:00 UK during the clock-change gap weeks (in 2027: 15 to 26 March, 1 to 5 November).
- MT5 shows server time. On a New York + 7 server, server midnight is the New York close and the week has five daily candles.
- Decide one day convention, write it on your plan, and use it consistently.
Practice exercise
- While the market is open, note the server time in MT5's Market Watch and the current UK time. Work out your broker's offset from UK time, then from New York time.
- Open an XAUUSD D1 (daily) chart and check whether there is a Sunday candle. Then on an H1 chart find the daily pause: on a New York + 7 server the hour from 00:00 server is often missing or thin, because that is 17:00 to 18:00 New York.
- Write down this week's New York close in UK time. Check whether this week falls in one of the gap periods.
- Take the previous trading day's high and low from your MT5 XAUUSD D1 chart and from a web chart. If they differ, find which day convention each uses.
Not investment advice. This lesson is for education only. Trading leveraged products such as CFDs on gold carries a high risk of losing money quickly. Examples are illustrative and say nothing about future results.