
Educational content only. Not investment advice. This lesson explains how to read a chart. It doesn't tell you to buy or sell anything.
By the end of this lesson you can: build support and resistance zones from swing points, count touches in a consistent way, and describe role reversal, including the many times it doesn't happen.
Support and resistance are positions, not types
In Lesson 1 a key level was a zone where price turned before. Support and resistance describe where that zone is compared with current price:
- A zone below price is called support.
- A zone above price is called resistance.
The zone itself doesn't change. Only its position relative to price does. If price moves from below a zone to above it, the same zone that was called resistance is now called support. Keeping this in mind avoids a common confusion: a zone isn't "a support level" forever.
Building zones by clustering
- List the swing points. Use one timeframe at a time and both swing highs and swing lows.
- Choose a tolerance in ATR, for example 0.25 to 0.35 ATR. Points closer together than this belong to the same zone.
- Group the points. Sort them by price and group neighbours that are within the tolerance.
- Merge zones that overlap or nearly touch. Two thin zones a fraction of ATR apart are usually one area.
- Keep zones with at least two touches, and drop the rest.
Counting touches
A touch here means one swing point inside the zone. Count highs and lows together: a zone that stopped a rally in March and held a decline in April has two touches.
More touches mean that more turns happened in that area in the past. They don't make the zone more likely to hold next time. Some readers argue that a zone tested many times is weaker, because orders there have been used up. Both views are opinions. Your job is to count consistently and record what happens next.
Record the split as well, for example "4 touches: 3 highs, 1 low". A zone with both highs and lows has already acted from both sides, which leads to role reversal.
Role reversal
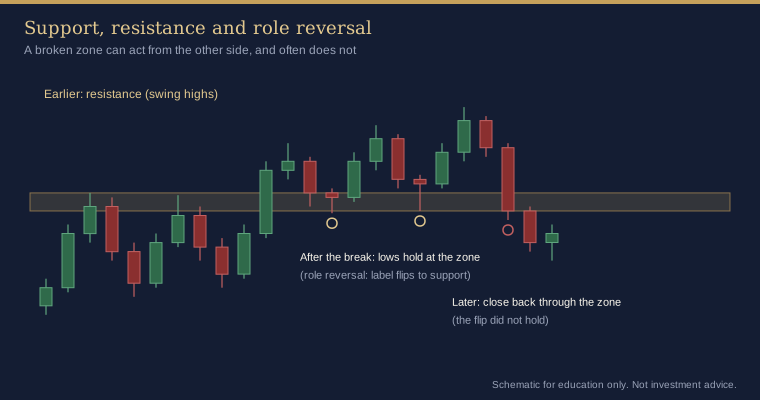
Role reversal is the pattern where a zone that turned price from one side later turns it from the other. Resistance is broken, price comes back to the zone, and the zone appears to act as support. The reverse can happen too.
Role reversal is well known, which is exactly why it needs care:
- It often fails. Price breaks a zone, comes back, and closes straight back through it. The diagram shows both outcomes on the same zone.
- The break has to be defined. A wick through a zone isn't the same as candles closing beyond it and staying there. Decide in advance what you count as a break, for example a candle close beyond the outer edge of the zone.
- The retest has to be defined. Write down what counts as a return to the zone (a touch within a set fraction of ATR) and what counts as failure (a close back through it by a set amount).
Course 3 turns these ideas into exact, testable rules. For now, the aim is to notice role reversal and record it honestly.
Merging nearby zones
Charts often show several zones a few dollars apart. Too many lines make it hard to decide anything. Some guidelines:
- If two zones are within about half your tolerance of each other, treat them as one.
- Cap the map at about six zones and rank them by timeframe and touch count.
- Remove zones that price has moved far away from. You can add them back later.
How the indicator shows this
Line Alert Snap. The indicator builds zones in the same way as the steps above: swing points within Alignment tolerance (default 0.25 × ATR14) are grouped, groups need at least Min swing points per level (default 2), and neighbouring groups are merged. Swing highs and lows are counted together. Each dotted zone's tooltip shows the touch count and the split, for example x5 (2H / 3L). A zone with both H and L touches has acted from both sides. The four alert lines show the touch count of the zone they sit on as x5 in the panel. With Level selection set to Most touches (the default), lines go to the zones with the most touches before nearer ones, so they can sit some distance from price. Nearest qualifying levels chooses the closest zones instead.
Aurum SMC signal XAUUSD indicator, S/R zones. If you also use the Aurum SMC signal XAUUSD indicator, its support and resistance boxes come only from swing pivots (10 bars each side by default). Pivots within S/R pivot merge tolerance (0.35 × ATR) join one zone, which is drawn S/R zone width (0.25 × ATR) tall. A zone appears after S/R min touches (2), and the six nearest to price are shown. The label shows stars equal to the touch count (capped at five) and switches between Support and Resistance according to whether the last closed candle is above or below the zone. That switch is a change of position, as described at the start of this lesson. It doesn't mean the zone held. These zones are never removed when price breaks them, so you have to judge yourself whether a flip held or failed.
Common mistakes
- Calling a zone "support" after price has closed well below it.
- Reading a high touch count or a star rating as a measure of how likely the zone is to hold.
- Counting every wick near a zone as a new touch, instead of counting swing points only.
- Showing only role reversals that worked.
Key takeaways
- Support and resistance describe a zone's position compared with price. They are not fixed types.
- Build zones by clustering swing highs and lows within an ATR tolerance, and count both together.
- A touch count is history, not a probability.
- Role reversal happens and fails often. Define the break, the retest and the failure before you look.
Practice exercise
- On XAUUSD H4 or H1, build zones from the last few weeks of swing points using a 0.25 ATR tolerance. Write the touch count and the high/low split beside each zone.
- Find one zone that price closed through. Mark whether it came back to the zone, and whether it then held or closed back through.
- Find a second example with the opposite outcome. Put both on one page with the date, the timeframe and the ATR value.
- If you have the indicators, compare your zones with the Line Alert Snap tooltips and the Smart Money Concepts S/R labels. Note where the label switched while the zone failed.
Not investment advice. This lesson is for education only. Trading leveraged products such as CFDs on gold carries a high risk of losing money quickly. Examples are illustrative and say nothing about future results.