
Educational content only. Not investment advice. This lesson explains how to read a chart. It doesn't tell you to buy or sell anything.
By the end of this lesson you can: mark a key level as a zone on an XAUUSD chart, give its width in ATR rather than in dollars, and say what the level does and does not tell you.
What a key level is
A key level is a price area where the market turned more than once in the past. On a chart it shows up as a group of swing highs, swing lows, or both, sitting at roughly the same price.
A swing high is a candle whose high is above the highs of the candles on both sides of it. A swing low is the mirror image. One swing point is a single turn. Several swing points at about the same price make an area that traders notice, record and refer back to.
That is all a level is: a record of where price reacted before. It is a reference point for planning and review. It makes no prediction.
What a key level is not
- It is not a forecast. A level doesn't mean price will turn there again. Price can stop there, pass straight through, or turn and come back. Each of these happens often.
- It is not one exact price. Swing points almost never line up to the cent. Gold can move several dollars in a few seconds, so a single line drawn to two decimal places gives a false sense of precision.
- It is not an instruction. A level is where you check your plan. It is not a reason to act on its own.
A level is a zone, not a line
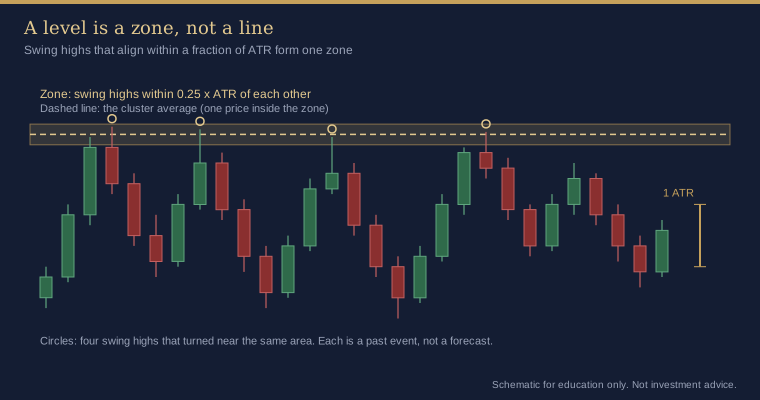
Draw a level as a zone: a band from the lowest to the highest of the swing points that make it up. If you want one price for an alert or a note, choose it on purpose. It could be the average of the swing points, the outer edge, or the edge nearest to current price. Write down which one you used.
A zone also makes your review honest. "Price reacted inside the zone" and "price closed beyond the zone" are things you can check. "Price respected my line" usually isn't.
Measure in ATR, not in dollars
Gold's volatility changes a lot. A $5 move can be routine on one day and large on a quiet one. A fixed dollar width for zones, or a fixed dollar distance for "close to the level", will therefore mean different things in different weeks.
ATR (Average True Range) solves this. It is the average size of recent candles, including any gaps from the previous close. ATR(14) on the chart timeframe is a common choice. Then you can say:
- "Swing highs within 0.25 ATR of each other count as one zone."
- "Price is 0.5 ATR from the zone."
- "The zone is 0.3 ATR wide."
These statements mean the same thing on a busy day and a quiet day. Always note the ATR value and the timeframe it came from, because ATR on M5 and ATR on H4 are very different numbers.
Timeframe hierarchy
A zone from H4 or daily swing points has taken longer to form and is seen by more chart readers than a zone from M5 swings. A simple ranking:
- Weekly and daily swing zones.
- H4 and H1 swing zones.
- M15 and M5 swing zones, for detail inside the larger picture.
Mark the higher timeframes first. Use lower timeframes to refine an area, not to fill the chart with lines.
Hindsight bias
Levels always look obvious after the event. Once you know where price turned, it's easy to draw the line that "worked" and forget the ones that didn't. To guard against this:
- Mark levels before the session and save a screenshot with the time on it.
- Count the zones that failed as well as the ones that held.
- Never move a level after the event to make your review look better.
How the indicator shows this
The Line Alert Snap indicator finds swing zones automatically when its Auto placement input is set to Swing high / low clusters (the default):
- Swing points. A bar counts as a swing high or low when it is the extreme of the bars on each side. Swing strength sets how many bars on each side (default 5). The search covers the last 500 bars (Lookback) of the Swing timeframe, which is the chart timeframe by default. On M5 that is under two days; on H1 it is about three weeks.
- ATR. The indicator uses a 14-bar average true range on completed bars as its unit of distance.
- Zones. Swing points within Alignment tolerance (default 0.25 × ATR) are grouped. A group needs at least Min swing points per level (default 2). Neighbouring groups that touch are merged into one zone.
- What you see. With Show all detected levels on, each zone is drawn as a dotted line. Hover over it and the tooltip shows the zone's range, its average, the touch count and the split between highs and lows, for example
Swing zone … (avg …) x4 (3H / 1L). - Line price. Line price within level chooses the cluster average, the outer edge or the inner edge, which is the choice described above.
The newest swing is confirmed using the bar that is still forming, so it can appear earlier than older swings did. If there isn't enough history, the lines fall back to fixed spacing, and those prices are not levels.
Common mistakes
- Treating one swing point as a level.
- Drawing lines to the cent and then reading every small overshoot as a "break".
- Using fixed dollar distances across weeks with very different volatility.
- Drawing zones after the move and counting only the ones that held.
Key takeaways
- A key level is a zone where price turned before. It describes the past.
- Measure widths and distances in ATR, and note the timeframe the ATR comes from.
- Rank zones by timeframe and mark the higher timeframes first.
- Mark zones before the session and review them honestly afterwards.
Practice exercise
- Open an XAUUSD H1 chart covering about three weeks. Note the current ATR(14).
- Mark every swing high and low you can see. Group any that sit within 0.25 ATR of each other, and draw each group as a zone.
- Keep only zones with at least two swing points. Write down each zone's width in ATR.
- If you have the Line Alert Snap indicator, attach it with default settings and compare its dotted zones and tooltips with yours. Note where you differ and why.
- Save a dated screenshot. Next week, record for each zone whether price reacted inside it, closed through it, or never reached it.
Not investment advice. This lesson is for education only. Trading leveraged products such as CFDs on gold carries a high risk of losing money quickly. Examples are illustrative and say nothing about future results.