
Educational content only. Not investment advice. This lesson explains how to read a chart. It doesn't tell you to buy or sell anything.
By the end of this lesson you can: mark swing and internal pivots on a chart, describe the sequence of highs and lows, and say on which candle each pivot actually became known.
Why structure comes first
Every Smart Money Concepts (SMC) tool in this course is built on market structure: the sequence of turning points that price leaves behind. Order blocks, fair value gaps and liquidity pools only make sense once you know which highs and lows matter. If the structure is read wrongly, everything built on it is wrong too.
Pivots: a precise definition
A pivot high is a candle whose high is above the highs of a set number of candles on its left and isn't exceeded by the same number on its right. A pivot low is the mirror image. The number of candles on each side is the pivot length.
The pivot length decides what you see:
- A long length (for example 10 candles each side) finds only the major turns. These are swing pivots.
- A short length (for example 3 candles each side) also finds the smaller turns inside a move. These are internal pivots.
Both are valid. They describe the same price action at two levels of detail. Swing structure gives the larger picture, while internal structure shows how each leg develops.
Describing structure: HH, HL, LH, LL
Compare each pivot with the previous pivot of the same kind:
- HH (higher high) and HL (higher low): each turn is above the one before. This is often called bullish structure.
- LH (lower high) and LL (lower low): each turn is below the one before. This is often called bearish structure.
- LH with HL: the range is narrowing.
- HH with LL: the range is widening, and the structure is unclear.
These labels describe what has happened. They say nothing about what happens next. A run of higher highs can end at any time.
Swing and internal structure often disagree. Swing structure may still show higher highs while internal structure inside the latest leg is already making lower highs. That's normal, and you should note both instead of choosing whichever suits a view.
Confirmation lag: the most important idea in this lesson
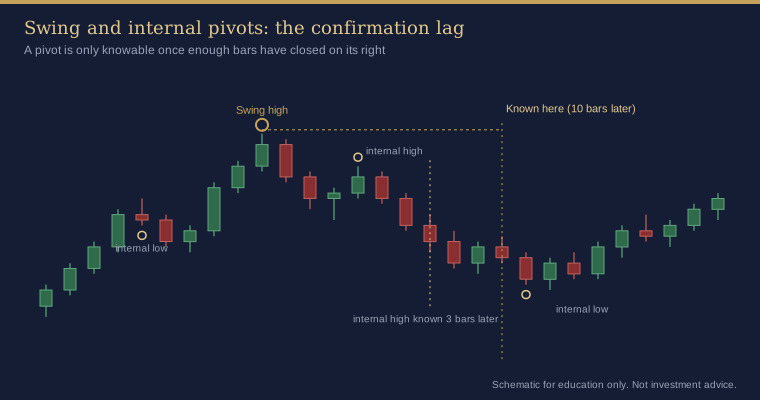
A pivot needs candles on both sides. You can only know a candle was a pivot high after the candles on its right have closed without going above it. With a pivot length of 10:
- The pivot is marked on the candle where the high was made.
- It is known only when the 10th candle after it has closed.
On M15, that is two and a half hours later. On H1 it's ten hours, and on H4 it is more than a day and a half.
This matters because a chart shows the label on the pivot candle, not on the candle where it was confirmed. When you scroll back through history, every turning point looks as if it was visible at the time, but it wasn't. Anyone studying a chart after the event sees structure earlier than anyone watching live could have.
Rule for this course: whenever you write down a pivot, write down two times: when it formed and when it was confirmed. Any idea that depends on the pivot can only start from the confirmation time.
Internal pivots lag less (3 candles), which is one reason they're useful. The trade-off is that they're far more frequent and include many minor turns.
A note on candle closes
Pivots are found from highs and lows, but structure breaks in the next lesson need a candle close. A pivot is only confirmed once its right-hand candles have closed, so this course reads structure from closed candles only. The candle that is still forming can change until its final tick.
How the indicator shows this
The Smart Money Concepts indicator tracks two structure layers at once, using its Structure inputs:
- Swing pivot length (Swing structure pivot length, default 10) and internal pivot length (Internal structure pivot length, default 3). A third length, Liquidity pivot length (default 5), is used for liquidity pools in later lessons.
- A pivot high must be above each of the candles on its left and not exceeded by any candle on its right. An equal high on the right still counts.
- Everything is calculated on closed candles only. A pivot is registered when the candle pivot length bars later closes, which is exactly the lag described above.
- The indicator doesn't print HH/HL/LH/LL text. It shows structure through its break lines: each BOS or CHoCH line starts at the pivot that was broken and ends at the candle that broke it. Swing breaks are solid lines labelled
BOSorCHoCH. Internal breaks are dotted and labellediBOSoriCHoCH. Show swing BOS / CHoCH and Show internal BOS / CHoCH switch each layer on or off. - History is processed for up to Bars to process (default 3000) from a fixed start point. Changing timeframe or reloading can move that start, so labels at the far left of the chart may differ between loads.
The next lesson covers what those break lines mean.
Common mistakes
- Treating a pivot as known on the candle it marks.
- Mixing swing and internal pivots in one HH/HL sequence.
- Changing the pivot length until the chart shows the structure you expected.
- Reading HH/HL as a forecast instead of a description.
Key takeaways
- A pivot is defined by a fixed number of candles on each side: long lengths give swing structure, short lengths give internal structure.
- HH, HL, LH and LL describe the past sequence of turns.
- Every pivot has two times, formed and confirmed. Only the confirmation time is usable.
- Read structure from closed candles only.
Practice exercise
- On XAUUSD H1, mark swing pivots with a length of 10 and internal pivots with a length of 3, in two colours.
- For the last three swing pivots, write down the time each formed and the time it was confirmed, in UK time and broker server time.
- Label the swing sequence (HH, HL, LH, LL) and the internal sequence inside the latest leg. Note where they disagree.
- If you have the indicator, attach it with default settings and check that each break line starts at one of your pivots. Find one where you'd have assumed the pivot was visible earlier than it was.
Not investment advice. This lesson is for education only. Trading leveraged products such as CFDs on gold carries a high risk of losing money quickly. Examples are illustrative and say nothing about future results.