
Educational content only. Not investment advice. This lesson explains how to read a chart. It doesn't tell you to buy or sell anything.
By the end of this lesson you can: mark the previous day high and low and the previous week high and low on an XAUUSD chart from the correct candles, record each one as a narrow zone, and note whether it has been taken.
The four levels
These levels need little judgement to find once the day boundary is fixed. Each one is the extreme of a fixed period of time:
- PDH (previous day high): the highest price of the previous trading day.
- PDL (previous day low): the lowest price of the previous trading day.
- PWH (previous week high): the highest price of the previous trading week.
- PWL (previous week low): the lowest price of the previous trading week.
"Previous" means the last completed period. On a Tuesday, the PDH is Monday's high. On a Monday, the previous trading day is normally Friday; if Friday was a market holiday, it is Thursday. The PWH and PWL stay the same all week.
Why chart readers mark them
Unlike a swing zone (Lesson 1), a previous day high is the same, or almost the same, number for everyone who uses the same day boundary; small differences between brokers' price feeds remain. Because they are easy to find, many traders write them down and some platforms draw them automatically. They are shared reference points.
A PDH is a record of where price stopped yesterday. It is not a ceiling and it doesn't predict anything. Price can reach it and turn, pass through it, or never reach it, and each happens often. Lesson 20 adds one more idea: some traders assume that orders rest just beyond these highs and lows. That is an assumption about the market, not something your chart shows.
Get the day and the week right first
A previous day level is only as good as the day it comes from. Lesson 3 explained that this course uses the New York close (17:00 New York) as the end of the trading day, which is normally 22:00 UK and 21:00 UK in the clock-change gap weeks. On a broker server at New York time plus 7 hours, that close falls at 00:00 server time, so the D1 candles on your MT5 chart already match the convention. If your server uses a different offset, your daily candles end at a different time, and your PDH and PDL can differ from those on a chart that closes at the New York close.
The week works the same way. Gold futures on CME Globex reopen at 18:00 New York time on Sunday, which is 23:00 UK for most of the year (22:00 UK in the gap weeks). Many spot brokers reopen gold at around the same time, but check your own broker's hours. The trading week ends at the New York close on Friday. The previous week high and low are the extremes of that whole period, so read them from your broker's W1 candles or from the highest and lowest of that week's daily candles (normally five on a New York + 7 server, and sometimes fewer in holiday weeks).
Holidays. Around public holidays many brokers shorten gold trading or close it. Examples are Christmas Day on Friday 25 December 2026 and Good Friday on 26 March 2027. Check your broker's holiday notice. After a short day, the next PDH and PDL may come from only a few hours of trading, so the "previous day range" can be unusually narrow.
A high is a price, but mark it as a zone
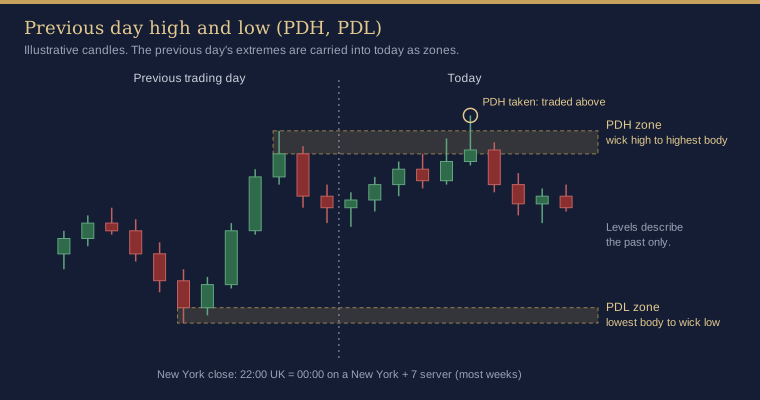
The PDH is one exact price, but it was printed by one candle's wick, sometimes in a few seconds of thin trading. Lesson 3 warned that prices around the daily pause can be thin and spreads wide, and a high printed by a spread spike may not reflect where most of the market was dealing. Different brokers can also show slightly different highs for the same day.
A simple way to record this, in the spirit of Lesson 1 (a level is a zone, not a line):
- Note the exact high (the wick).
- Note the highest candle body on the timeframe you use for detail, for example H1, near that high.
- Treat the band between the two as the PDH zone. If the band is very narrow, you can use the exact price alone.
Measure distances to the zone in ATR, for example "price is 0.8 ATR(14) H1 below the PDH zone", so the note means the same in quiet and busy weeks. Do the same for the PDL, PWH and PWL.
Taken and untaken
Once today's price has traded beyond yesterday's high, the PDH has been taken. Lesson 20 removes taken levels from its liquidity map, because the orders assumed to rest beyond them are assumed to have been triggered.
For each level, a short record keeps your review honest:
- Not reached today.
- Reached, no close beyond: price traded into or through the zone (say which) but no candle on your chosen timeframe closed beyond it.
- Closed beyond: one or more candles closed beyond the zone.
- Closed beyond and came back: price closed beyond, then closed back inside the previous day's range (the previous week's range for PWH and PWL).
Write which timeframe you used for "close"; Lesson 8 covers this in more detail. None of these outcomes tells you what happens next. Over many days, they show how often each one occurs.
How the indicator shows this
Line Alert Snap also draws previous day levels. Its MQL5 Market listing (titled "incl Session & PDH/PDL") and its screenshots show the previous day high and low (PDH and PDL) drawn automatically from the previous full day, extended forward and replaced each new day. The listing doesn't show previous week levels, so in this course the PWH and PWL are marked by hand. Check the indicator's PDH and PDL against your own written levels: if your server's day doesn't end at the New York close (Lesson 3), the two can differ. These lines are separate from its four alert lines, which come from swing high and low clusters (Lesson 1), so a swing zone near yesterday's high is a different thing from the PDH itself, even when the two sit close together. Placing one of its alert lines on a previous day level is covered in Lesson 7. This describes the indicator as shown in the listing screenshots, which are labelled version 1.43; the listing showed version 1.42 when checked on 15 November 2026, so check the version you have installed.
If you also use AURUM Liquidity Retest, its liquidity map can include these levels: Use previous day high / low and Use previous week high / low take them from the broker's D1 and W1 candles and list them only while the current day or week hasn't yet traded beyond them. In its code, PWH and PWL have priority 3 and PDH and PDL priority 2. They follow your server's day boundary, one more reason to check it.
Common mistakes
- Taking the PDH from a chart whose day ends at UK midnight and comparing it with a plan built on the New York close.
- On a Monday, taking the PDH and PDL from a small Sunday candle instead of the last full trading day.
- Leaving a taken PDH on the chart as if it were still untested.
- Recording only the days when price turned at the level.
Key takeaways
- PDH, PDL, PWH and PWL are the extremes of the last completed trading day and week. They are easy to find and widely watched, and they describe the past only.
- Their values depend on the day and week boundary: check your server against the New York close.
- Mark each level as a zone from wick to body, and measure distances in ATR.
- Track whether each level was not reached, reached, closed beyond or closed beyond and came back, every day, not just on memorable days.
Practice exercise
- Work out your server's offset from New York time and check whether server midnight is 17:00 New York (Lesson 3).
- Mark today's PDH, PDL, PWH and PWL from your XAUUSD D1 and W1 candles. On H1, find the body nearest each wick extreme (highest body for PDH and PWH, lowest body for PDL and PWL) and draw each level as a zone.
- Write the distance from current price to each zone in ATR(14) H1, with the date and UK time.
- At the end of the trading day, record for each level: not reached, reached with no close beyond, closed beyond, or closed beyond and came back. Repeat for five trading days.
Not investment advice. This lesson is for education only. Trading leveraged products such as CFDs on gold carries a high risk of losing money quickly. Examples are illustrative and say nothing about future results.