
Educational content only. Not investment advice. This lesson explains how to read a chart. It doesn't tell you to buy or sell anything.
By the end of this lesson you can: mark the Asia range and the London and New York opening prices on an XAUUSD chart using written times, convert those times into server time, including in the clock-change gap weeks, and record what price did around each one.
Sessions are conventions, not official hours
Spot gold trades almost around the clock from Sunday evening to Friday evening (Lesson 3). There is no official "Asia session" or "London session" for spot gold. The names describe the hours when dealers and traders in each region are most active, and activity, spreads and the size of moves often change as one region hands over to the next.
Because sessions are conventions, different sources use different times. That doesn't matter as long as you choose your times, write them down and never change them after the event. A session level drawn from times picked afterwards is hindsight, just like a level moved to fit the chart (Lesson 1).
The times this course uses
This course uses three session marks:
- Asia range: the high and low between 00:00 and 07:00 UK time.
- London open: the price at 08:00 UK time.
- New York open: the price at 08:00 New York time.
The Asia window is fixed in UK time for simplicity. It doesn't follow Asian clocks exactly: 09:00 in Tokyo is 00:00 UK in winter but 01:00 UK in British Summer Time. Other common choices include starting the Asia window at the New York close, or using 09:30 New York (the US stock market open) as the New York mark. Any of these is fine if you write it down.
Two other scheduled times often matter in these hours. The LBMA Gold Price auctions run at 10:30 and 15:00 London time, and many US economic releases come out at 08:30 New York time. Lesson 6 covers scheduled events.
Converting the session times
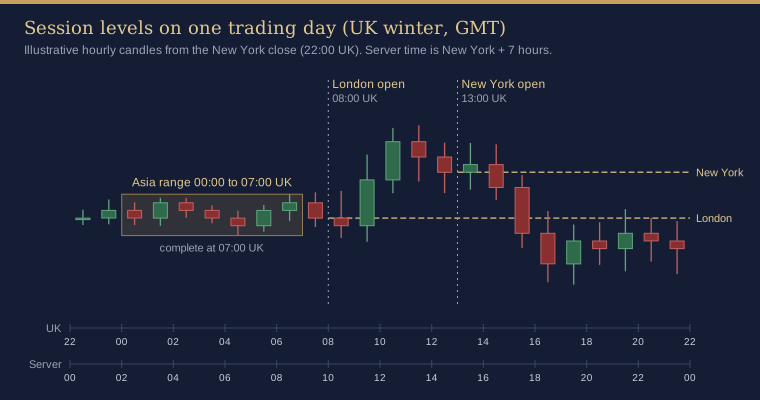
With a broker server at New York time plus 7 hours (Lesson 3), the session marks fall at these times:
| Most of the year | Gap weeks | |
|---|---|---|
| Asia range, 00:00 to 07:00 UK | 02:00 to 09:00 server | 03:00 to 10:00 server |
| London open, 08:00 UK | 10:00 server | 11:00 server |
| New York open, 08:00 New York | 13:00 UK = 15:00 server | 12:00 UK = 15:00 server |
Notice the pattern. On a New York + 7 server, anything fixed in New York time sits at the same server time all year. Anything fixed in UK time moves one hour later on the server in the gap weeks, when only one country has changed its clocks. In 2027 the gap weeks are 15 to 26 March and 1 to 5 November (trading days). If your server uses a different offset, build the same table for your broker.
The Asia range
The Asia range is the highest and lowest price in the Asia window. Gold often moves less during these hours than later in the day, so the range is often narrower than the London or New York moves, but not always: news from Asia, or a move carried over from the previous evening, can make it wide.
Three rules keep the range honest:
- It is only complete at 07:00 UK. Before then the high or low can still change. This is the same idea as confirmation lag in Lesson 10: write down the time the range became known, not just the prices.
- Measure its width in ATR. "The Asia range was 0.6 ATR(14) H1 wide" means the same thing in a quiet week and a busy one. A dollar figure doesn't.
- Treat its edges like any other level. They are records of where price stopped during seven hours. They don't predict that price will leave the range, or in which direction.
Later in the day, record what happened: price left the range on one side, left on one side and came back, traded beyond both sides, or stayed inside. Some traders talk about the Asia range as if leaving it carries a message. Your own records over many days are a better guide than that kind of talk, and they will often be mixed.
The London and New York opens
An opening price is a single price: the open of the candle that starts at the session time. Draw it as a horizontal line from that candle to the end of the day. On M5 or H1 the open of the 08:00 UK candle is the London open; on a New York + 7 server, the open of the 15:00 server candle is the New York open.
An open is a reference, not a zone of turns. Its use is descriptive: "at 11:00 UK price was 1.2 ATR above the London open" is a clear, checkable statement. Some readers also mark the high and low of the first hour after each open. If you do, note when that hour ended, for the same reason as the Asia range.
Be careful around the opens themselves. Spreads can be wider and moves faster in the minutes around a session change and around scheduled releases, so the first candle can print a wick that only a few prices traded at. Compare your chart's open with another feed now and then; small differences between brokers are normal.
How the indicator shows this
Line Alert Snap also draws session levels. Its MQL5 Market listing and screenshots show the previous day's Asia, London and New York session highs and lows drawn automatically, using these windows: Asia 09:00 to 18:00 Tokyo, London 08:00 to 17:00 London and New York 08:00 to 17:00 New York, converted to your broker's server time with US and UK daylight saving applied. Those windows are wider than the marks this course uses (the Asia range from 00:00 to 07:00 UK and the London and New York opening prices), so the indicator's Asia high and low will often differ from your own Asia range. Neither is wrong: write down which one you are using and keep to it. The indicator's four alert lines are separate and come from swing high and low clusters (Lesson 1), so they may sit near a session level by coincidence. Placing one of its alert lines on a level you marked yourself is covered in Lesson 7. This describes the indicator as shown in the listing screenshots, which are labelled version 1.43; the listing showed version 1.42 when checked on 15 November 2026, so check the version you have installed. Course 3 looks at how the AURUM Liquidity Retest indicator uses session times as a filter.
Common mistakes
- Using different session times on different days, or choosing them after seeing the chart.
- Forgetting that UK-based times move by an hour on the server in the gap weeks.
- Treating the Asia range as complete before 07:00 UK.
- Reading a move out of the Asia range as a signal, and remembering only the days it carried on.
- Measuring the range in dollars and comparing it across weeks with very different volatility.
Key takeaways
- Sessions are conventions. Choose fixed times, write them on your plan and keep them.
- This course uses the Asia range (00:00 to 07:00 UK), the London open (08:00 UK) and the New York open (08:00 New York).
- On a New York + 7 server, New York-based times are fixed; UK-based times move one hour later in the gap weeks.
- Session levels describe what price did in a window of time. They say nothing about what comes next.
Practice exercise
- Write your session times at the top of your level plan, in UK time and in your broker's server time, including the gap-week times.
- On an XAUUSD H1 or M5 chart, mark today's Asia range high and low after 07:00 UK. Write its width in ATR(14) H1 and the time it became complete.
- Draw the London open and New York open prices as horizontal lines.
- At the end of the trading day, record whether price left the Asia range above, below, both or neither, and where price finished compared with each opening price.
- Repeat for five trading days and count each outcome.
Not investment advice. This lesson is for education only. Trading leveraged products such as CFDs on gold carries a high risk of losing money quickly. Examples are illustrative and say nothing about future results.